intelligence of the numberverse
home
First Published July 2008
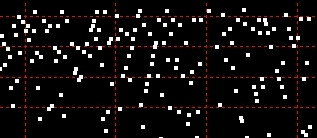
The Y axis is the number of primes; the X axis is the root of the perfect square. For example, in this graph, 324 (on the X axis) means the 324th perfect square root, so the perfect square is 324 * 324 = 104976. The previous perfect square is 323 * 323 = 104329. The difference (104976 - 104329 = 647) is the quadratic interval. The natural log of both perfect squares is approximately 11.56, so the expected count is (104976 / 11.56) - (104329 / 11.56) = 51. The actual prime count for this interval is 58.
Counting Primes by Quadratic Interval |
I offer a small program for counting primes by quadratic interval. The program simply counts how many primes occur from one perfect square to the next. (It uses trial division under 1012 and Miller-Rabin above that. However, it fails due to the limitation of the language's log function not far above that - said language I shall not reveal. Otherwise, it would continue into the e20s over the course of weeks, months, or years....) The PNT count is the basic version, using an unrefined prime-counting function - that is, N divided by the natural logarithm of N. The formula for applying this "expected" number to the interval between one perfect square and the next is constructed thus:
(Thanks to members of the MathForum for setting me straight about this.) Quadratic Interval Prime Counter
The results up to 100 million are viewable and downloadable here. A graph comparing the crude prime-counting function and the real count looks like this - showing the real count exceeding the expected count for most intervals - and deviating by larger amounts with larger intervals.
This graph does NOT show the cumulative prime count: real or expected. It shows the prime count from one perfect square to the next. This is something quite different than you will most likely see at other math sites where the prime-counting function is explained and graphed as a cumulative total, with the line showing a step-like pattern. This graphs show the total number of primes for each successive quadratic interval - and it demonstrates that the number of primes is increasing absolutely for successive intervals. The deviation between the real and log-derived count for each interval looks like this:
Close up, it looks like this...
|
© 2008 Michael M. Ross
|